
Who Really Won the 2020* Tokyo Olympics?
So we know USA won overall medals and gold medals, but what are the deeper cuts? Which countries outperformed their population? Which events did Europe stand out in? What drove USA’s medal victory over China?
To analyze this, I used medal points: bronze medals receive 1 point, silver medals receive 2, and gold receive 3. Also, the Russian Olympic Committee is being treated as the representatives from the country of Russia (well, duh).
Code for this project is here.
Superlatives
- Best country: USA!
- Most efficient country: New Zealand
- Best program: USA swimming & diving
- Most efficient program: New Zealand canoe & rowing
- Best continent: Europe
- Most efficient continent: Oceania
- Best continent program: European cycling (winning 75% of all medal points)
- Most efficient continent program: Oceania canoe & rowing
Country Winners
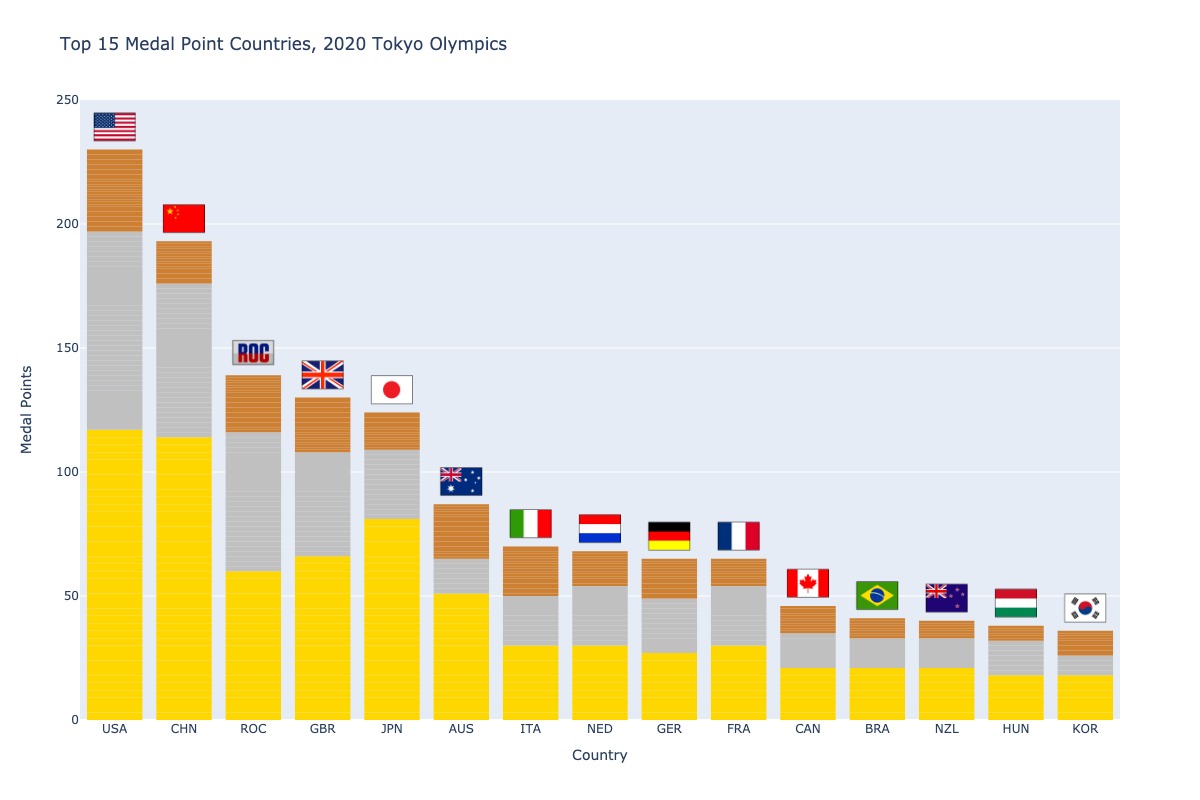
Let’s start with the overall medal point count: USA comes out on top with 230 points, ahead of China’s 193 and Russia’s 139. USA also eeked out the gold medal count win with 39 golds compared to China’s 38 golds.
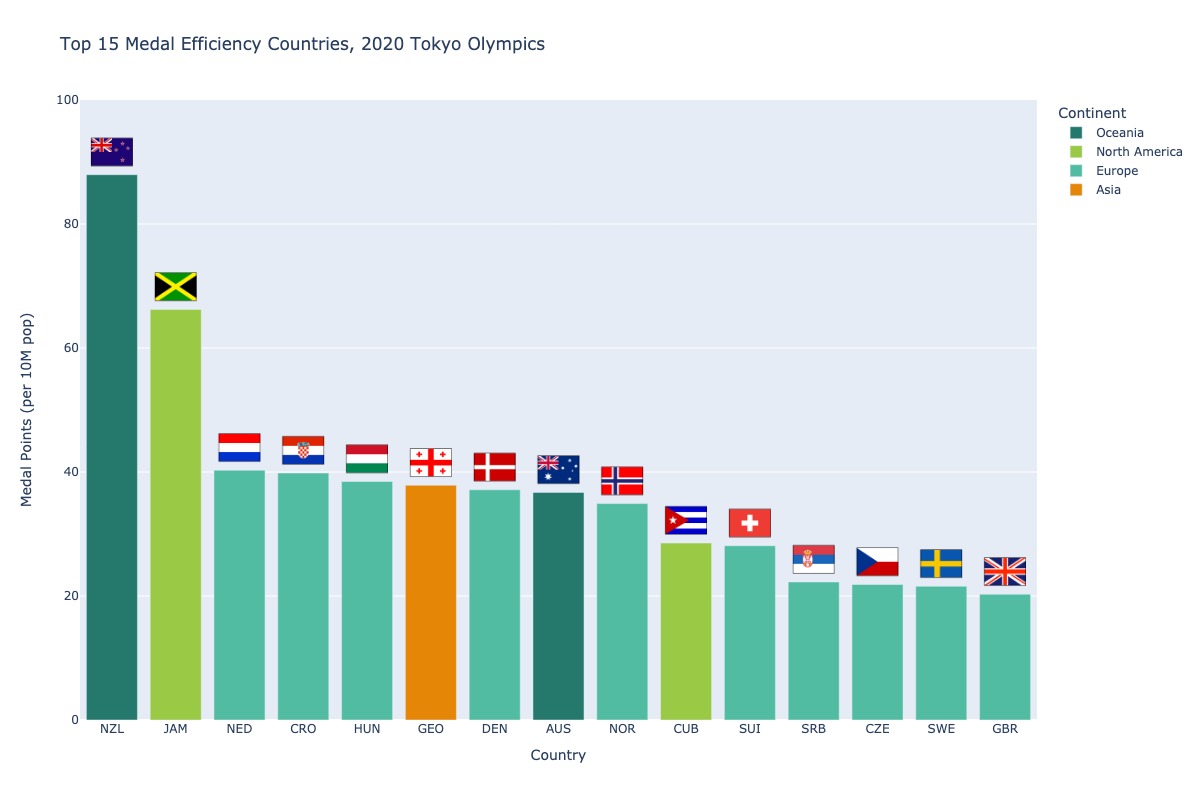
On a per-population basis, things don’t look as bright for the Americans who fall out of the top 15. In fact, there are two significant outliers with New Zealand (population 4.5M) and Jamaica (population 2.7M) standing out above a series of mostly-European countries. For context, USA scores 7.2 points per 10M population, good for 51st overall.
Note that this data has a minimum medal point threshold of 15 – without that threshold the country of San Marino (population 32k) would blow the competition away with their 4 medal points equating to 1,221 points per 10M population.
Country Event Winners
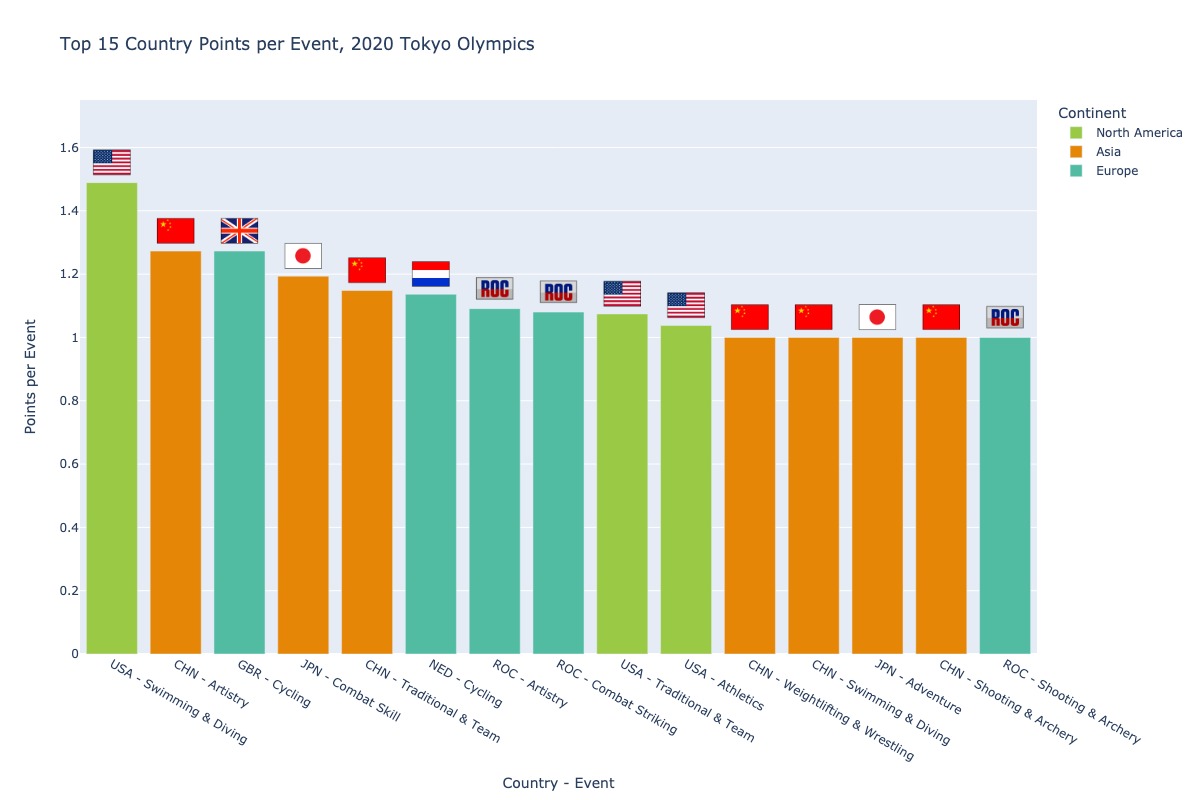
USA absolutely dominated the swimming and diving competitions, receiving 1.5 points per event – equivalent of winning a gold in every other event. The top event winners all seem to be the top medal getters, with the exception being the British and Dutch cycling teams, which won 1.3 and 1.1 points per event, respectively.
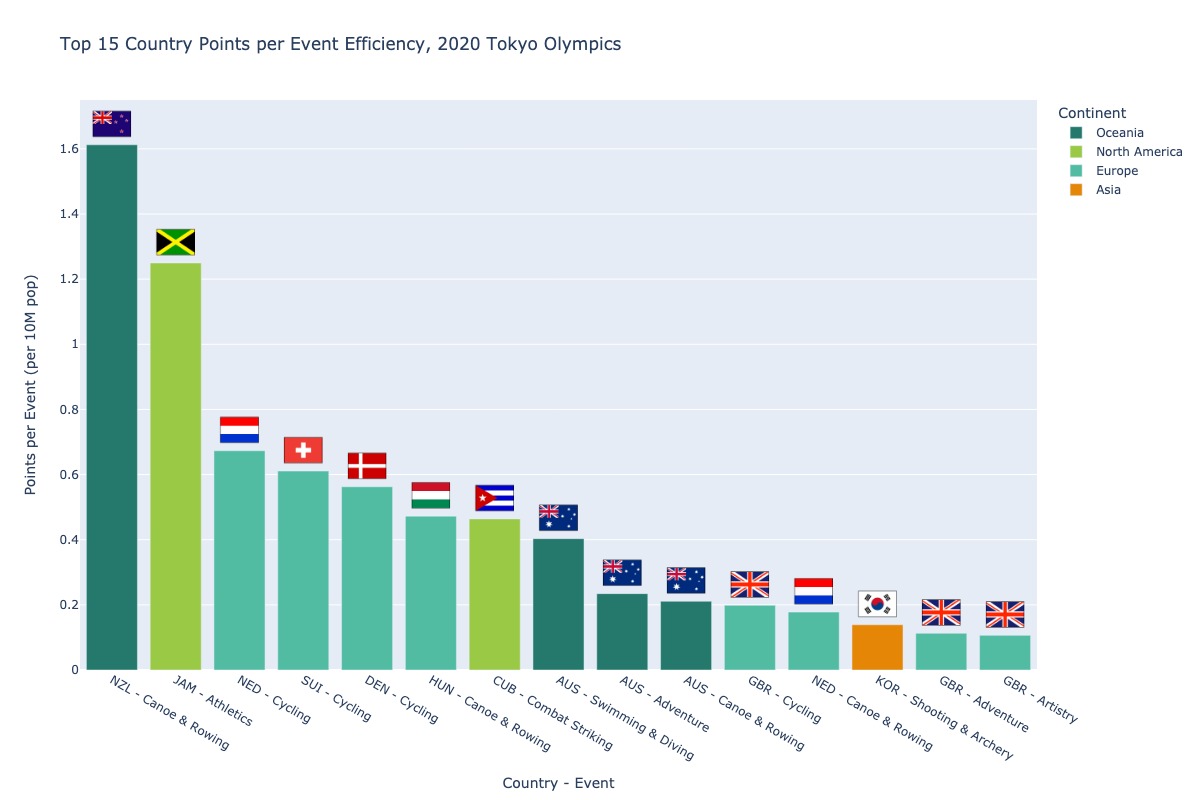
When normalizing for population, one again New Zealand and Jamaica stand out. New Zealand won 6 golds and 2 silvers in canoe & rowing events, outstanding for a country with as many citizens as Detroit. Jamaica athletics (track & field) may bring back memories of Usain Bolt and all the great Jamaican sprinters over the years – this year they continued to churn out an impressive amount of medals for such a small country. Take note of the European cycling performers – numbers 3, 4, 5, and 11 on the top 15 are European cycling programs.
Continent Winners
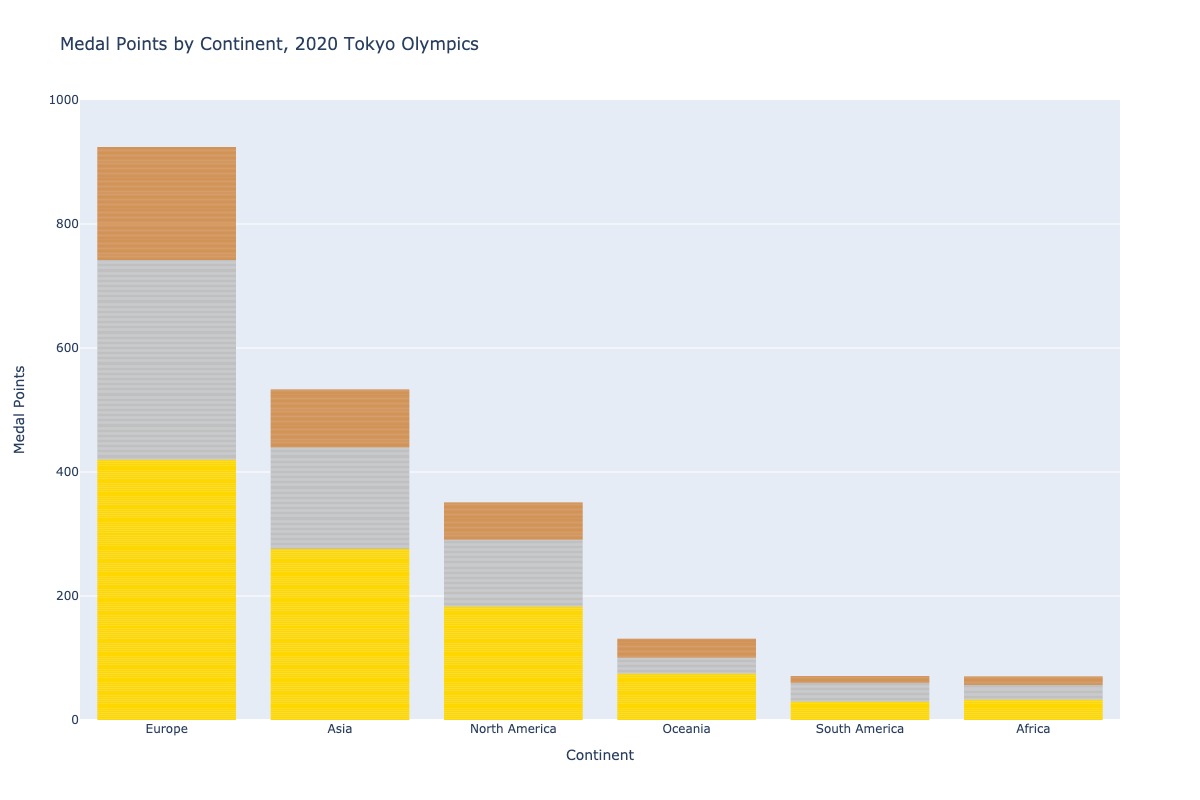
Europe winning this makes a lot of sense when you think about it: many very developed countries, each with dreams of winning medals, all counted together. I was surprised to see Oceania out-achieve both South America and Africa.
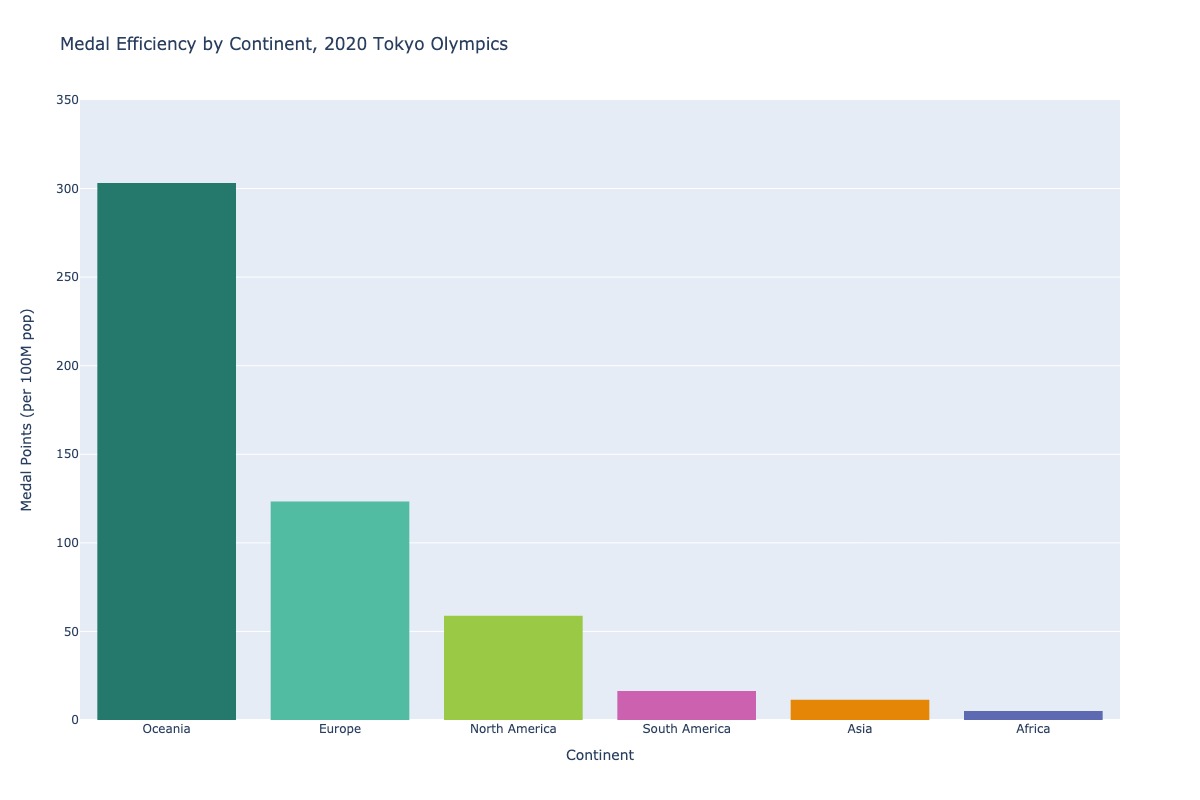
Oceania is a runaway winner on continent medals per 100M population. For being the least populated continent in the Olympics (population 43M; Antarctica did not participate this year) they really out-punched their weight. For context, scaling Oceania up to the size of Asia would mean that they would win 13,900 medal points, equivalent to over 6 total Olympic games.
Continent Event Winners
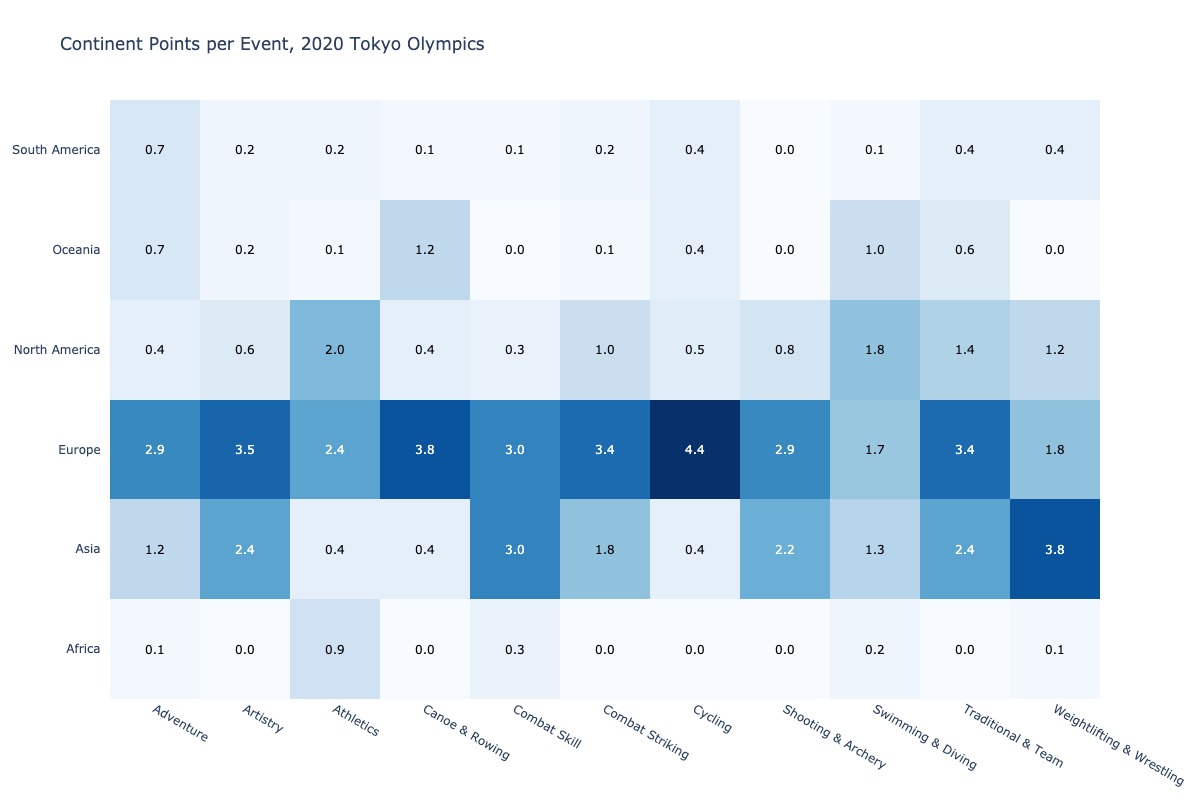
Looking at the event performance for each continent, it is clear why Europe won the most medals. They are 1st 9 of 11 event groups, with runaway victories in cycling and canoe & rowing events.
Think about what winning 4.4 medal points per cycling event means: on average Europe finished with gold, bronze, and 1/5th of silver.
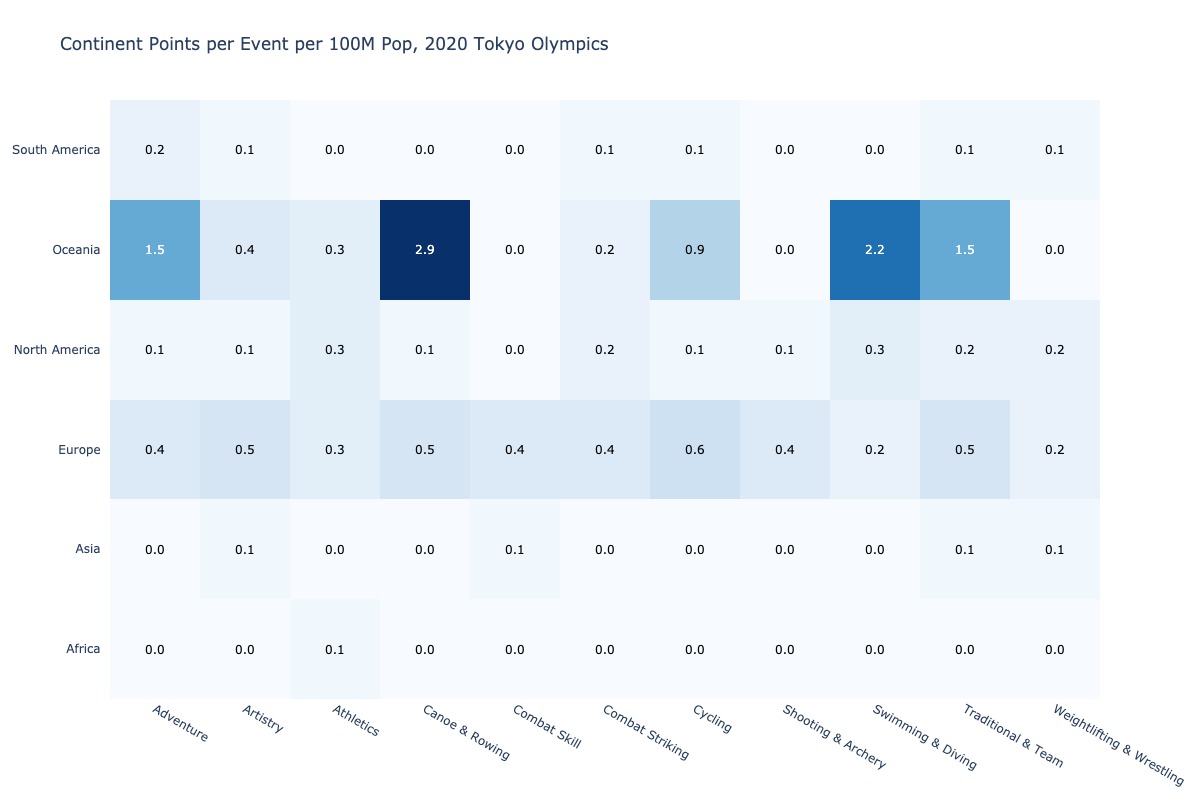
Normalizing by population, Oceania once again dominates the results. The Australian and New Zealand swimmers stand out along with the aforementioned canoe & rowing programs.
USA vs China
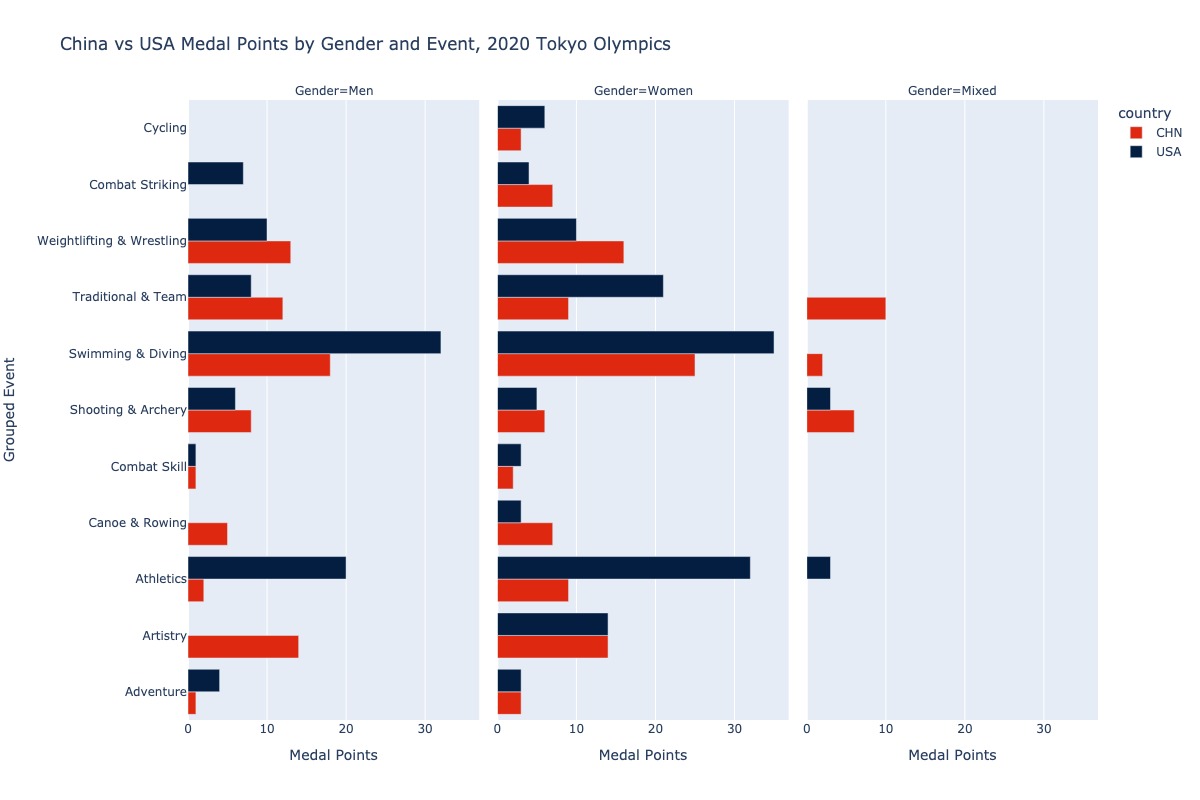
I took a deeper dive into the USA vs China medal race to see where each country was getting their medals from – here’s what I found:
- China doubled-up USA in artistry (gymnastics), driven completely from 0 points by USA’s men (the women tied with China)
- USA dominated China in athletics (track & field), winning 55 points to China’s 11; 35 of those USA points were won by female or mixed competitors
- While China was a respectable second place in swimming and diving, USA was #1 by a long shot, gaining 22 points on China in those events
- China clawed back 10 points by finishing gold-silver in mixed doubles badminton and table tennis…who knew those were Olympic sports!
Event Groupings
The lower-level events were grouped based on the following rules:
Artistry
Gymnastics, Artistic Swimming, Equestrian
Athletics
Athletics (track & field), Modern Pentathlon, Triathlon
Canoe & Rowing
Canoe, Rowing
Combat Skill
Taekwondo, Karate, Judo
Combat Striking
Fencing, Boxing
Shooting & Archery
Shooting, Archery
Swimming & Diving
Swimming, Diving
Traditional & Team
Baseball, Softball, Beach Volleyball, Field Hockey, Handball, Rugby, Soccer, Volleyball, Water Polo, Basketball, Tennis, Golf, Table Tennis, Badminton
Weightlifting & Wrestling
Weightlifting, Wrestling